
What is Data Analytics?
Data analysis is a process of inspecting, cleansing, transforming, and modeling data.
Data analytics refers to qualitative and quantitative techniques and processes used to enhance productivity and business gain.
Need for Data Analytics:
Data Analytics is needed in Business to Consumer applications (B2C). Organizations collect data that they have gathered from customers, businesses, economy, and practical experience. Data is then processed after gathering and is categorized as per the requirement and analysis is done to study purchase patterns etc.
Data Analysis Software tools build it easier for users to process and manipulate information, analyze the relationships and correlations between datasets:
- Data Analysis Software provides tools to assist with qualitative analysis like transcription analysis, content analysis, discourse analysis, and grounded theory methodology
- Data Analysis Software has the Statistical and Analytical Capability for decision-making methods
- Data Analysis The software process can be classified into descriptive statistics, exploratory data analysis (EDA), and confirmatory data analysis (CDA)
Important Types of Data Analysis Techniques:
Data analysis techniques are broadly classified into two types-
- Methods based on Mathematical and Statistical Approaches
- Methods based on artificial intelligence and machine learning
Mathematical and Statistical Approaches:

Descriptive Analysis is an important first step for conducting statistical analysis. It provides us with an idea of the distribution of data, helps detect outliers, and enables us to identify associations among variables, thus preparing the data for conducting further statistical analysis. Descriptive analysis of a huge data set can be made easy by breaking down it into two categories, they are descriptive analysis for each individual variable and descriptive analysis for combinations of variables.
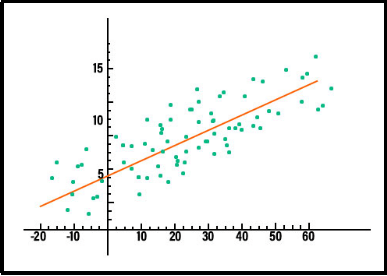
For example, consider the graph plotted on the right to have a clear understanding. In data mining, this technique is used to predict the values of a variable, in that particular dataset. There are different types of regression models in usage. A few of them are linear regression, logistic regression, and multiple regression.
Dispersion Analysis is the extent to which a distribution is stretched or squeezed. In the mathematical approach, the dispersion can be defined in two ways, fundamentally the difference of values among themselves and secondly the difference between the average value. If the difference between the value and average is very low, then we can say that dispersion is less in this case. And some of the common measures of dispersion are variance, standard deviation, and interquartile range.
Factor Analysis is a kind of data analysis technique, which helps in finding the underlying structure in a set of variables. It helps with finding independent variables in the data set that describes the patterns and models of relationships. It is the first step towards clustering and classification procedures. Factor analysis is also related to Principal Component Analysis (PCA) but both of them are not identical we can call PCA the more basic version of exploratory factor analysis.
Time Series analysis is a data analysis technique that deals with time-series data or trend analysis. Now, let us understand what is time-series data? Time series data is data in a series of particular time intervals or periods. If we see scientifically, most of the measurements are executed over time. Methods based on Machine Learning and Artificial Intelligence.
Decision Trees is a graphical representation, similar to a tree-like structure in which the problems in decision making can be seen in the form of a flow chart, each with branches for alternative answers. Decision trees are a top-down approach type, with the first decision node at the top, based on the answer at the first decision node it will be divided into branches, and it will continue until the tree arrives at a final decision. The branches which do not divide any more are known as leaves.
Neural Networks are a set of algorithms, which are designed to mimic the human brain. It is also known as the “Network of Artificial neurons”. The applications of neural networks in data mining are very broad. They have a high acceptance ability for noisy data and high accuracy results. Based on the necessity many types of neural networks are currently being used, few of them are recurrent neural networks and convolutional neural networks. Convolutional neural networks are mostly used in Image processing, natural language processing, and recommender systems. Recurrent neural networks are mainly used for handwriting and speech recognition.
Evolutionary Algorithms use the mechanisms inspired by recombination and selection. These types of algorithms are independent of the domain and they have the ability to explore large data sets, discovering patterns and solutions. They are insensitive to noise compared with other data techniques.
Fuzzy logic is an approach in computing based on “Degree of truth” rather than the common “Boolean logic” (truth/false or 0/1). As discussed above in decision trees at decision node we either have yes or no as an answer, what if we have a situation where we can’t decide absolute yes or absolute no? In these cases, fuzzy logic plays an important role. It is a diverse valued logic in which the truth value can be between completely true and completely false, that is it can take any real value between 0 and Fuzzy logic is applicable when there is a significant amount of noise in the values.
Conclusion
The tough question that all corporates or companies face is which type of data analysis technique is the best for them? We cannot define any technique as the best instead what we can do is try multiple techniques and see which one best fits our data set and use it. The above-mentioned techniques are some of the important techniques that are currently being used in the industry.